Visualizations
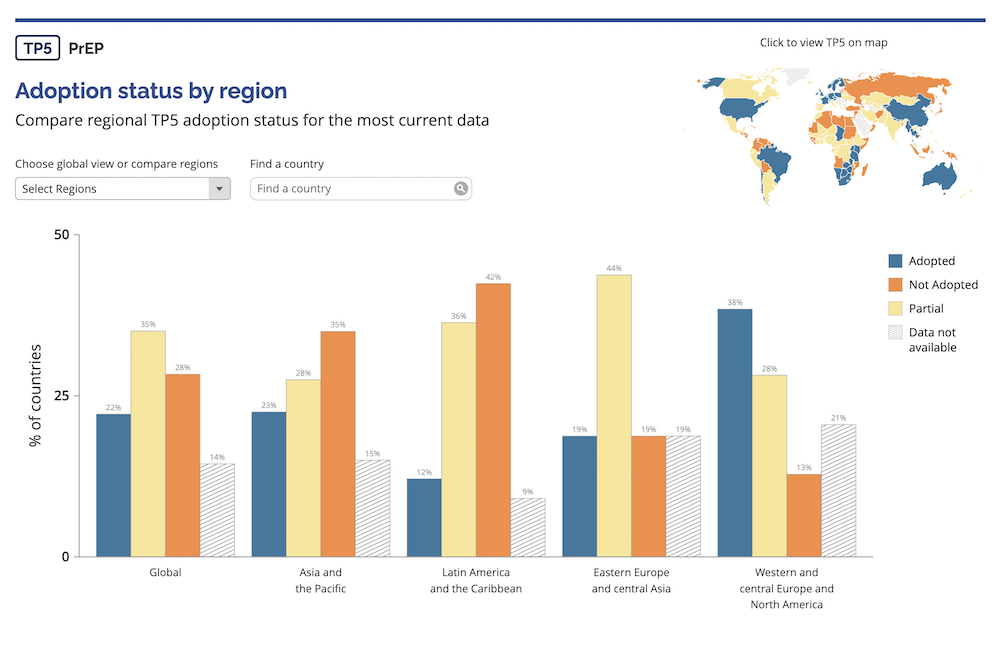
HIV Policy Lab Policy Adoption by Region
Typescript
HTML/CSS/JS
React
- Allows users to choose and display policy adoption bar charts for each region
- Option to highlight a specific country within the bar chart, displaying its flag
- Worked closely with designer throughout the process
- All state transitions are smoothly animated
- Designed and implemented frontend datastructure to make chart run smoothly without stuttering or loading
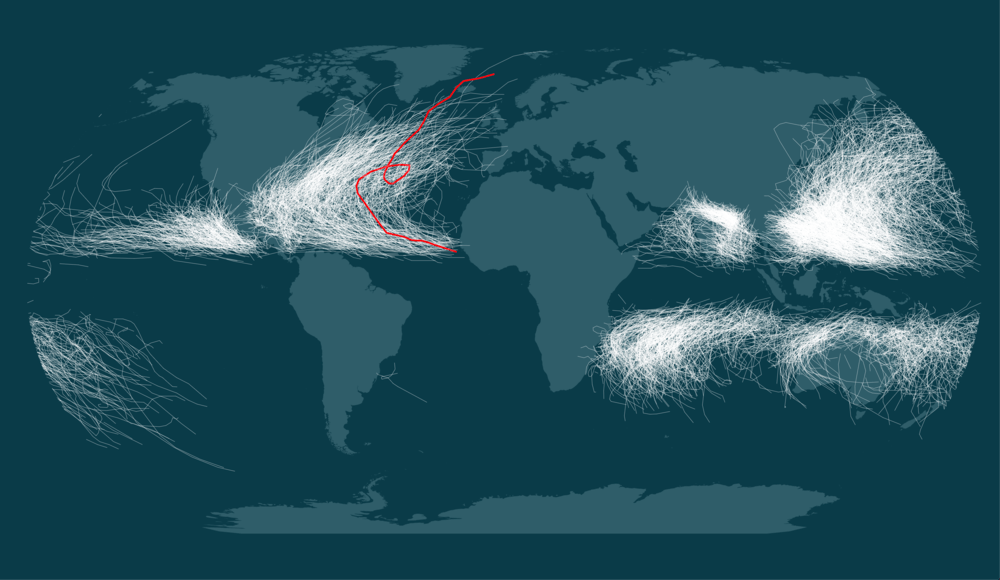
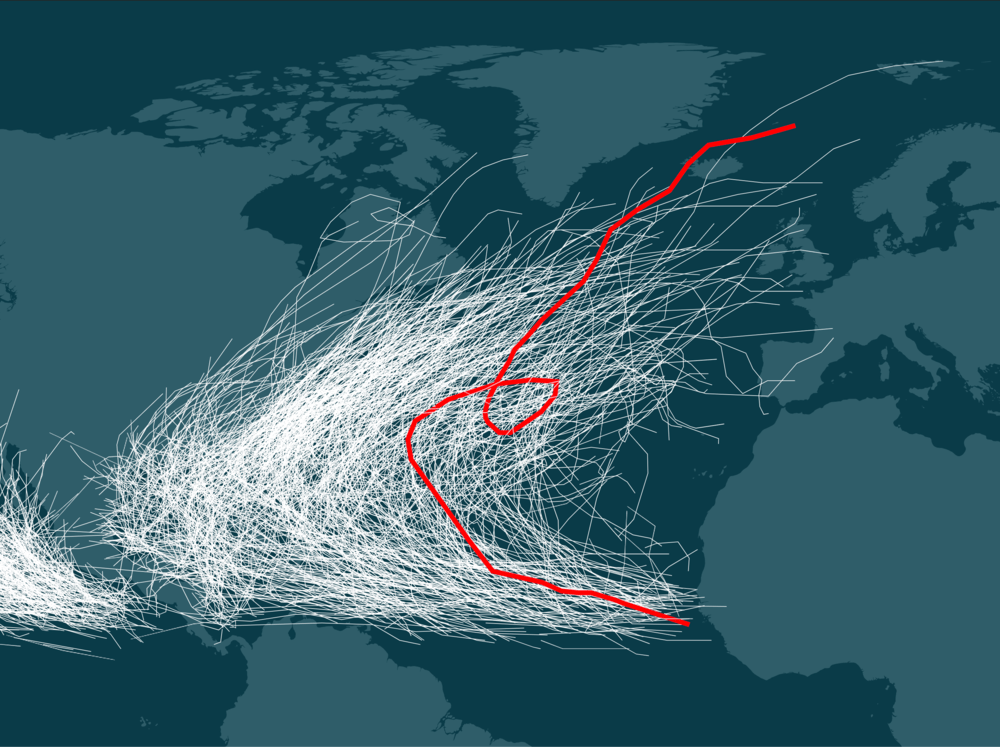
Hurricanes
Javascript
React.js
D3.js
- Tool to visualize and explore the stunning IBTrACS dataset of all recorded storms
- Reduced full detail (50+ mb shapefile) data to something manageable for web use (3.2mb GeoJSON file) while still sending all 85,000+ storms with reasonable visual fidelity
- Each storm is transformed and projected using D3-Geo and rendered as an svg element using react
- Memory and performance issues start after rendering over 5,000 storm tracks
- I would like to write a new version of this map tool using Svelte framework and rendering to canvas instead of SVG, which in theory should be performant enough to handle all the storms in the dataset at once reasonably quickly
Data Sources: |
|
| Storm Tracks: | NCDC International Best Track Archive for Climate Stewardship (IBTrACS), Version 4 |
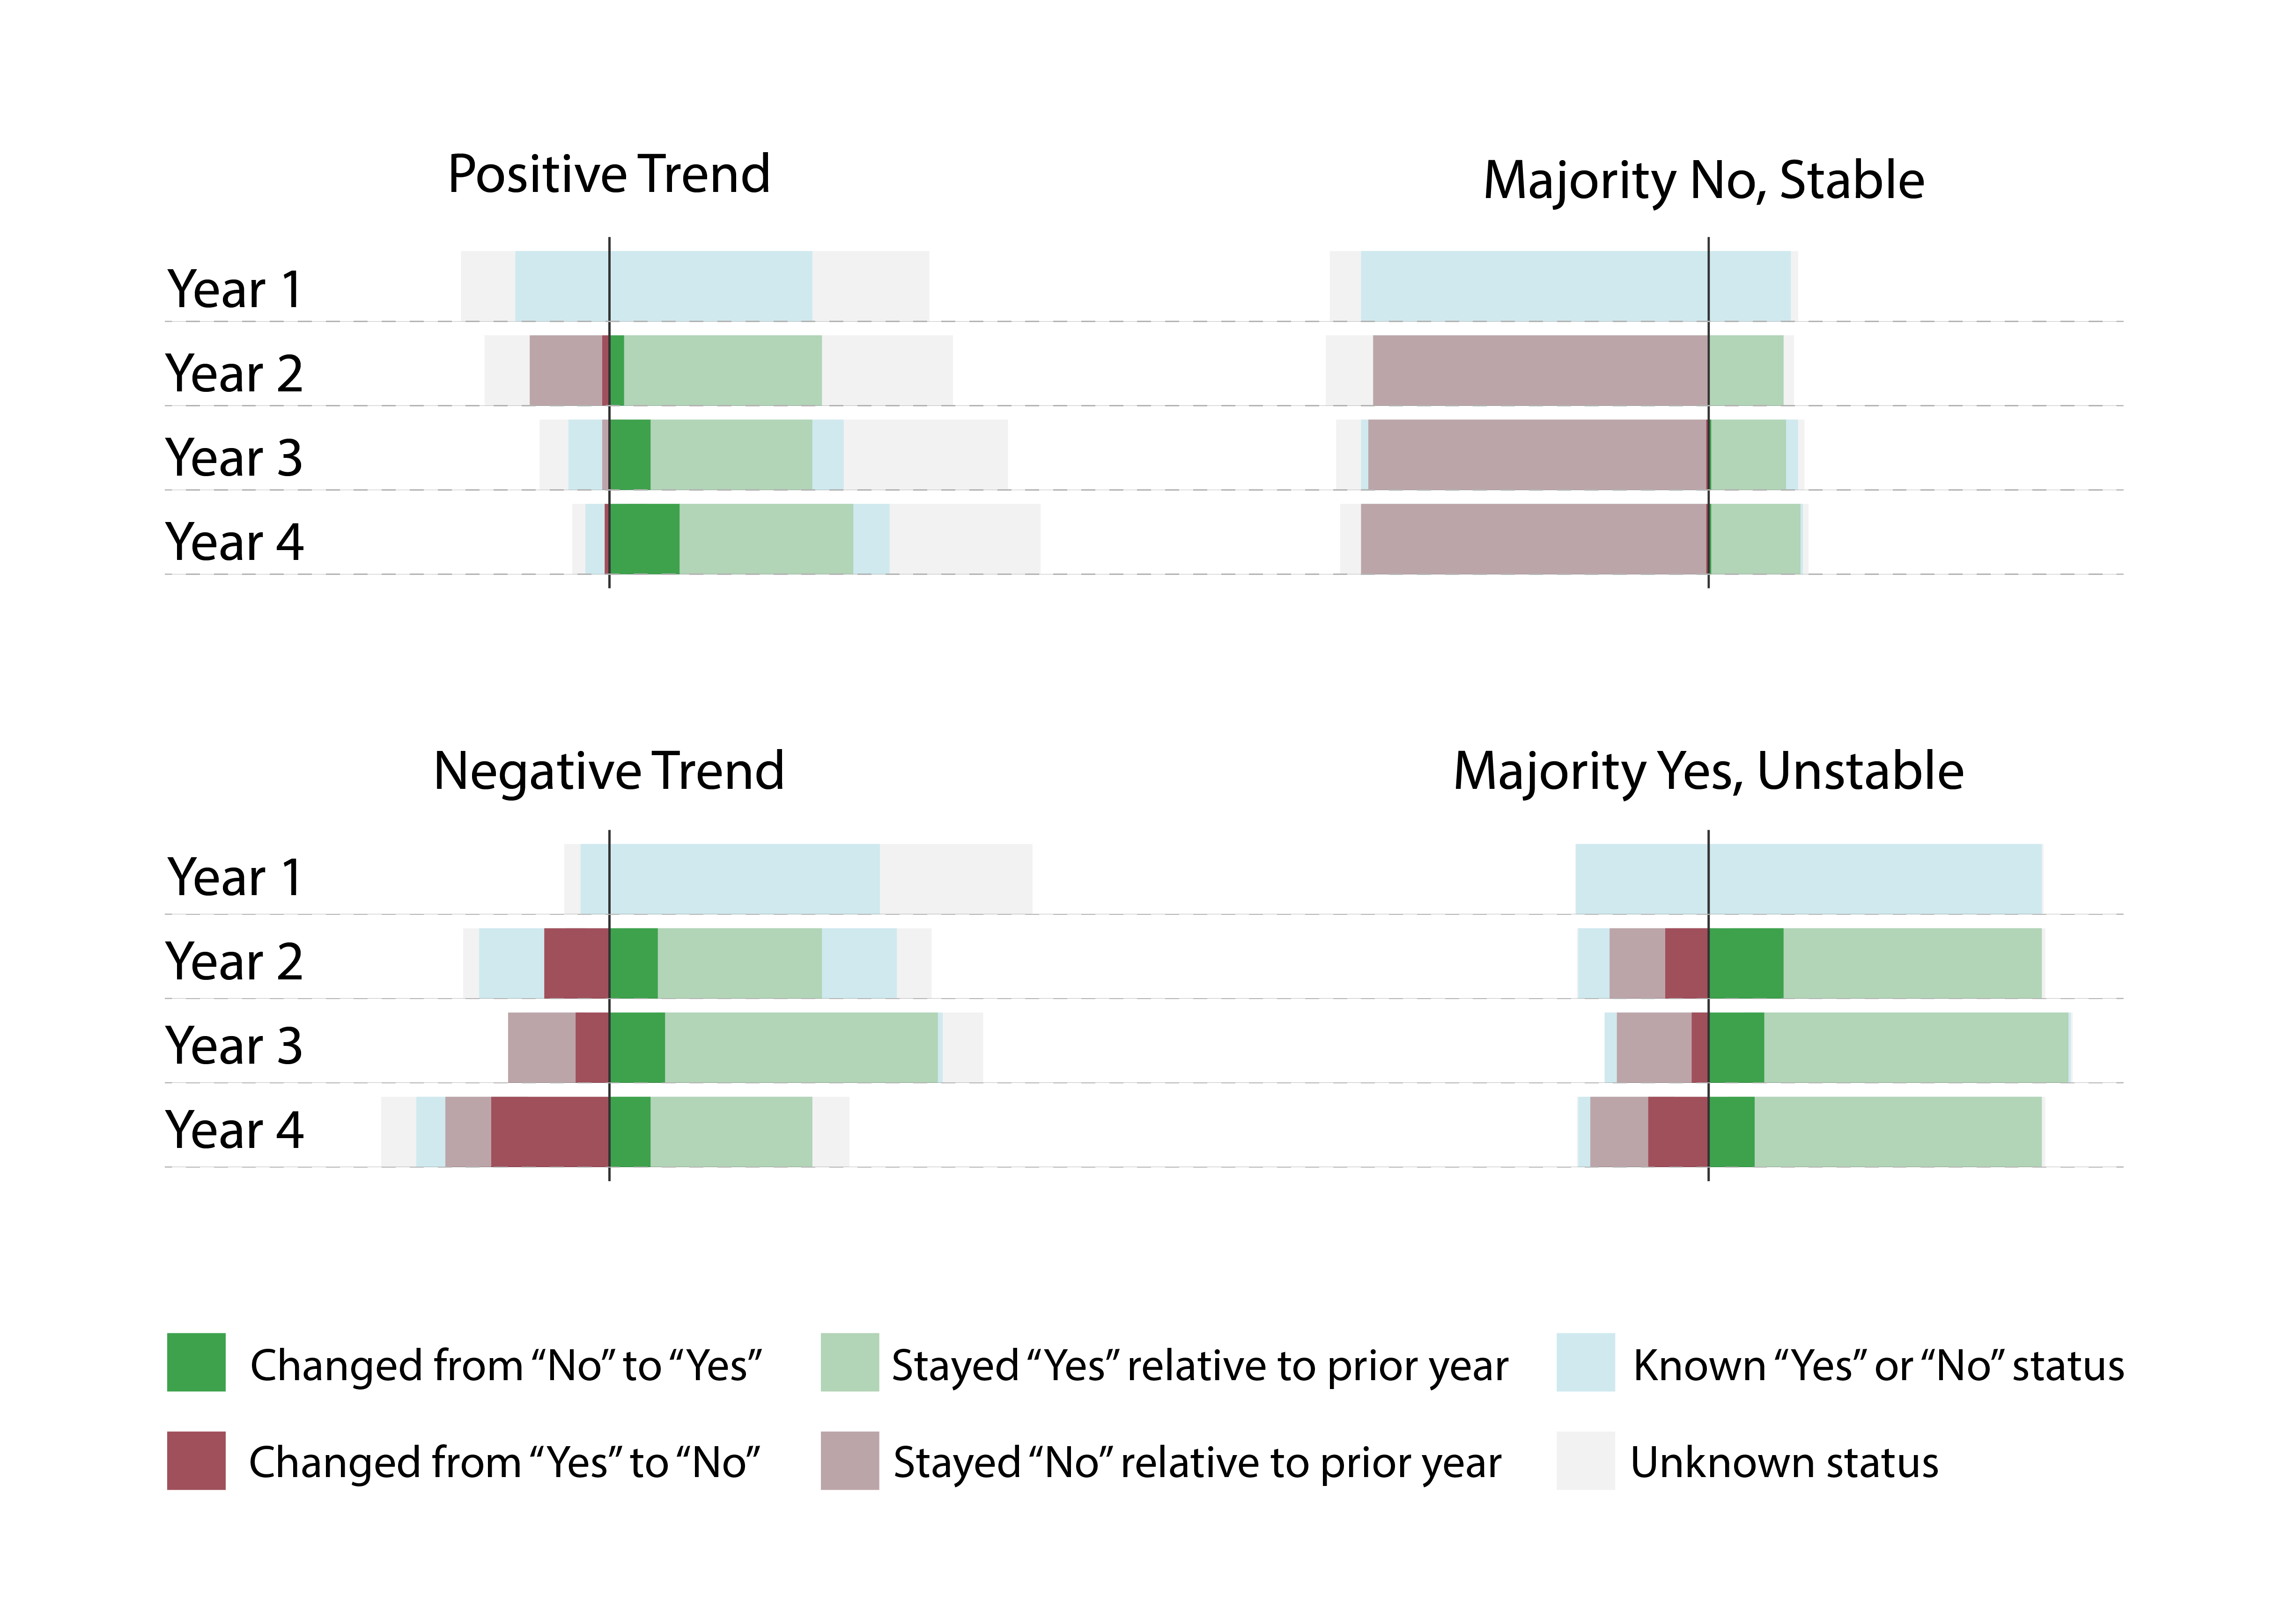
Custom Visualization of Changing Values with Incomplete Data
Javascript
React
Python
- Shows negative / positive overall state
- Shows how many datapoints changed from negative to positive state
- Shows how many datapoints were identified as no change between years
- Shows proportion of total values that are known, per year
- Javascript tool exports an SVG file for final adjustment in Adobe Illustrator or similar tools
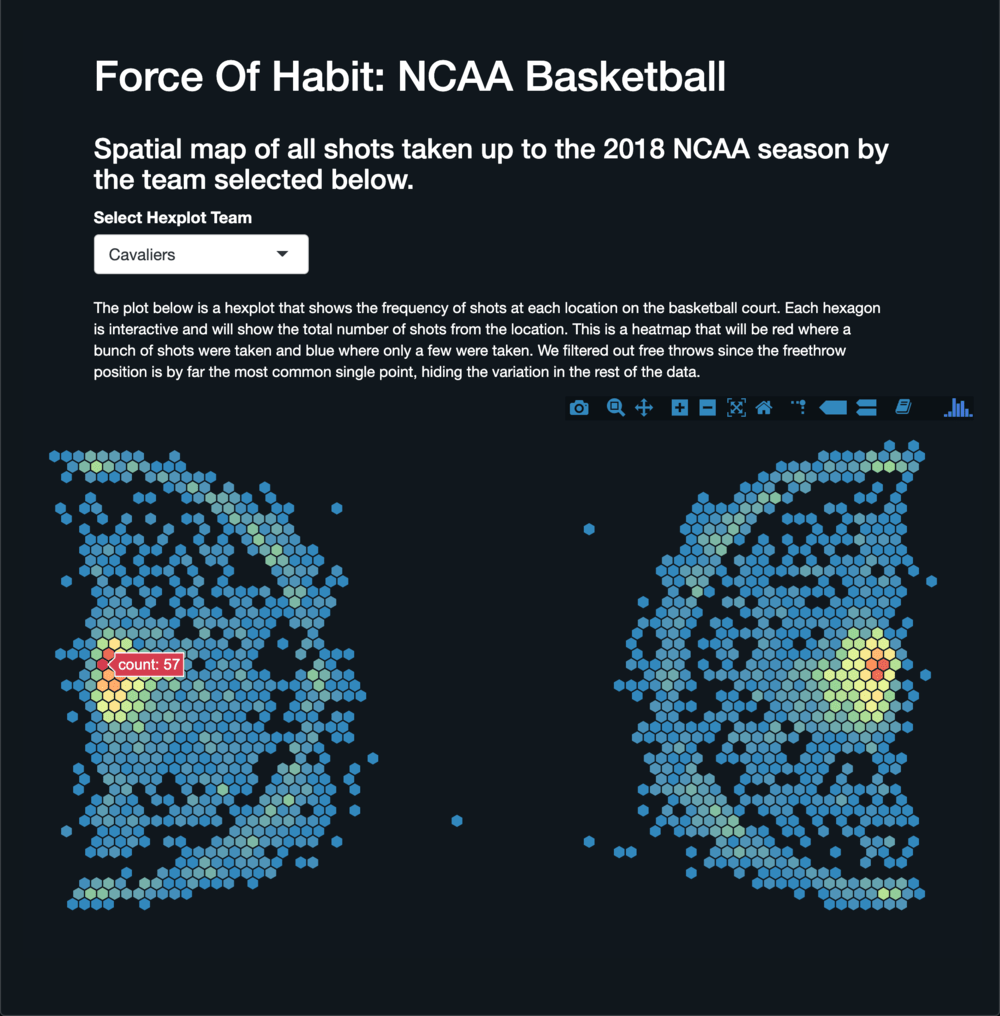
NCAA Basketball Shots Visualization
R
R Studio
Javascript
SQL
- Collected basketball data from Google BigQuery using SQL
- Selector widget allows user to choose specific teams from the (simplified) dataset
- Hex plot color shows number of successful shots from each bin
- Hover over hex bins to see exact count
- Plotly used to add zoom, pan, select, spikelines, and other controls
- Wrote custom loading and transition animations in Javascript to run on top of the Shiny App (which loads extremely slowly)
- Custom animations take control of the first SVG layer drawn by shiny app, fill each bin with random colors, and add a 'pulse' by scaling the graphic
- Once data is loaded and ready, random colors fade out to reveal the correct colors
Data Sources: |
|
| NCAA Basketball Data: | Google BigQuery |
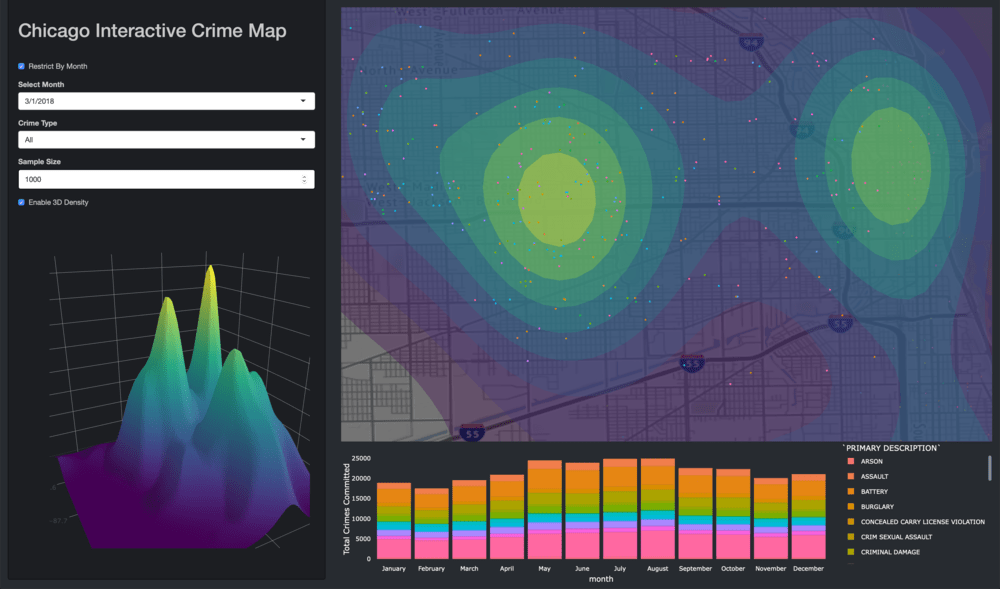
Chicago Crime Map
R
R Studio
- Selection widgets allow user to filter by month and crime type
- Entry box allows user to set sample size (by default the visualization only samples 1000 records due to perfermance issues with Shiny
- Lower left plot is an interactive, 3D kernel density estimate, with density along the Z axis and colors by height (density)
- Large map on the right side allows interactive zoom & pan of a heatmap generated based on the current filters
- Bar graph across the bottom displays the per-month incidence of the selected crime type.
Data Sources: |
|
| Chicago Crimes | Chicago Crimes 2001 - 2018 |