Mapping
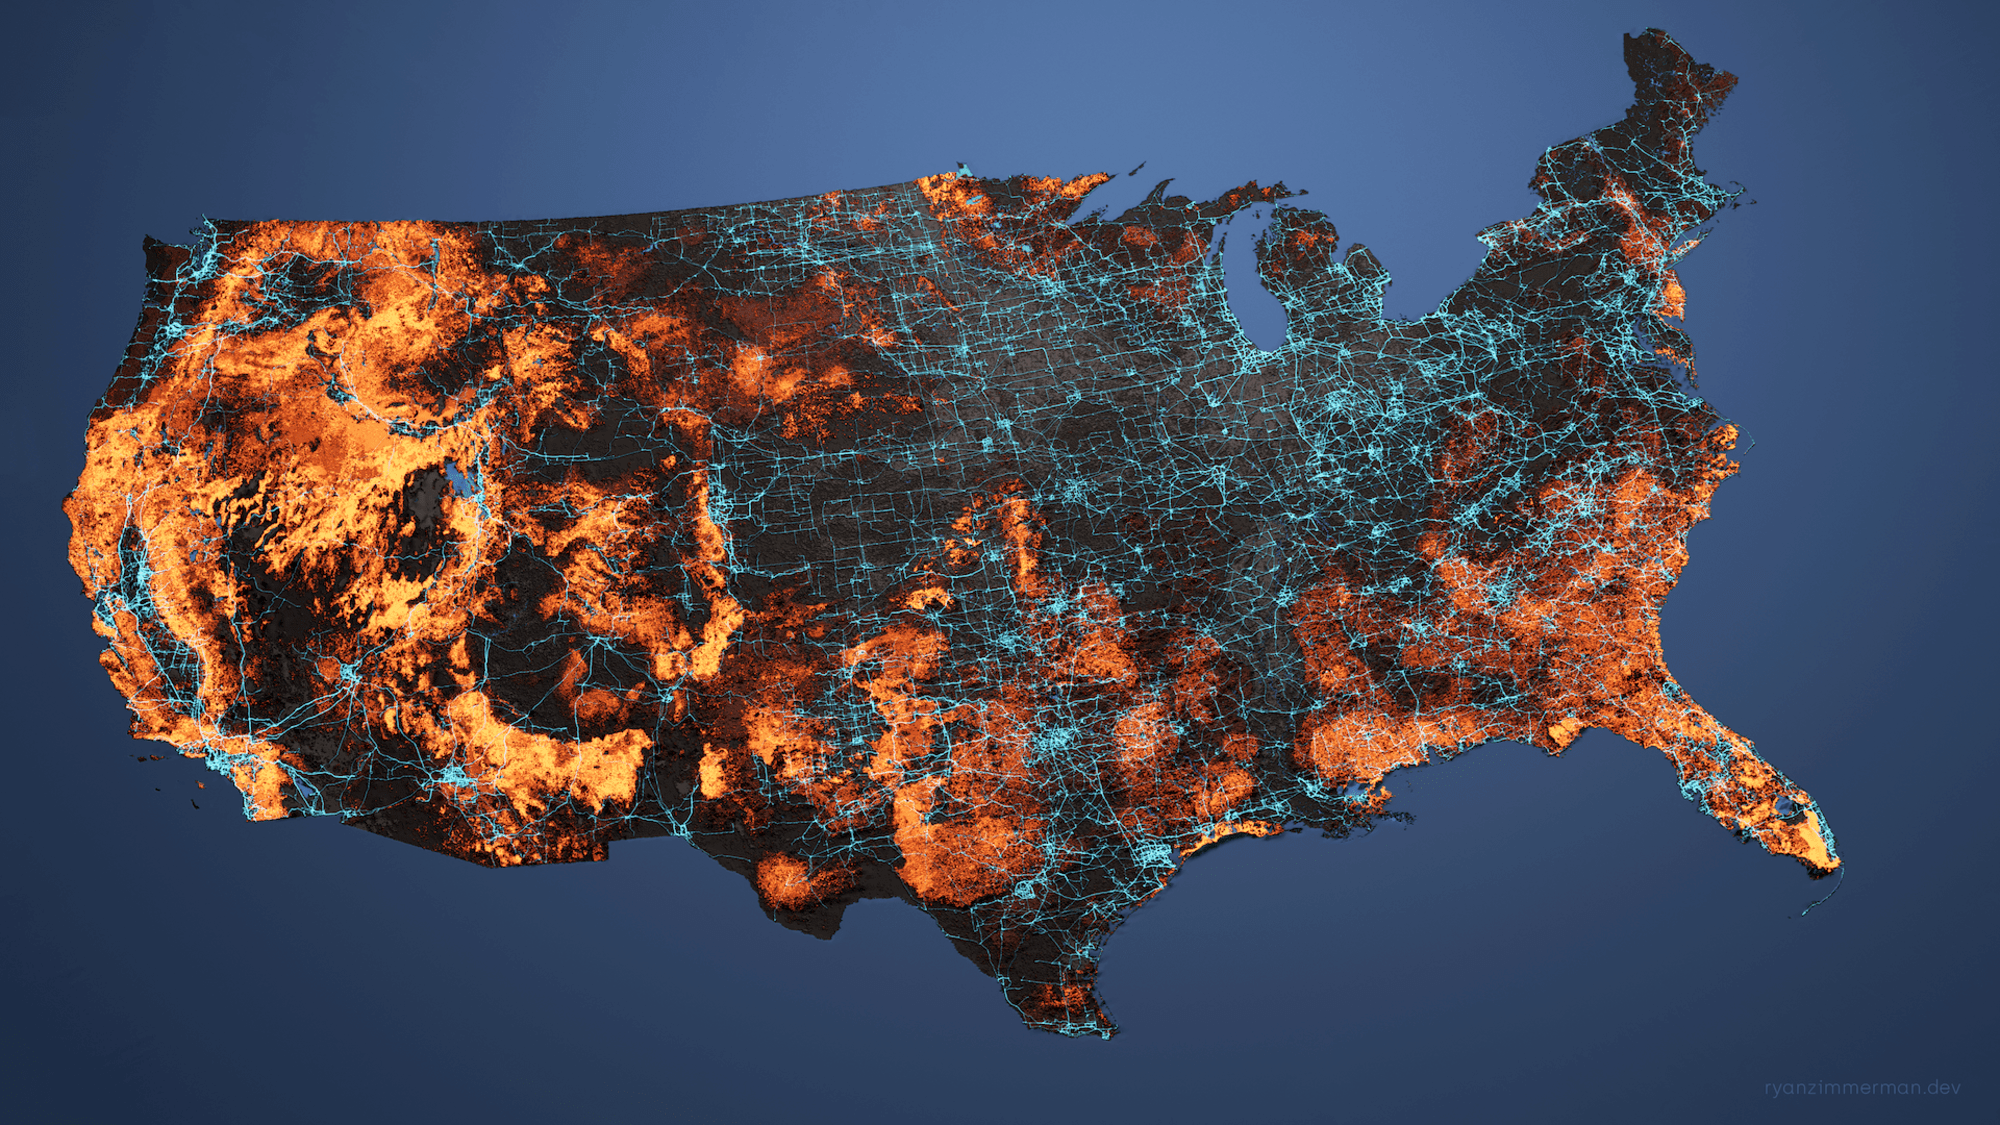
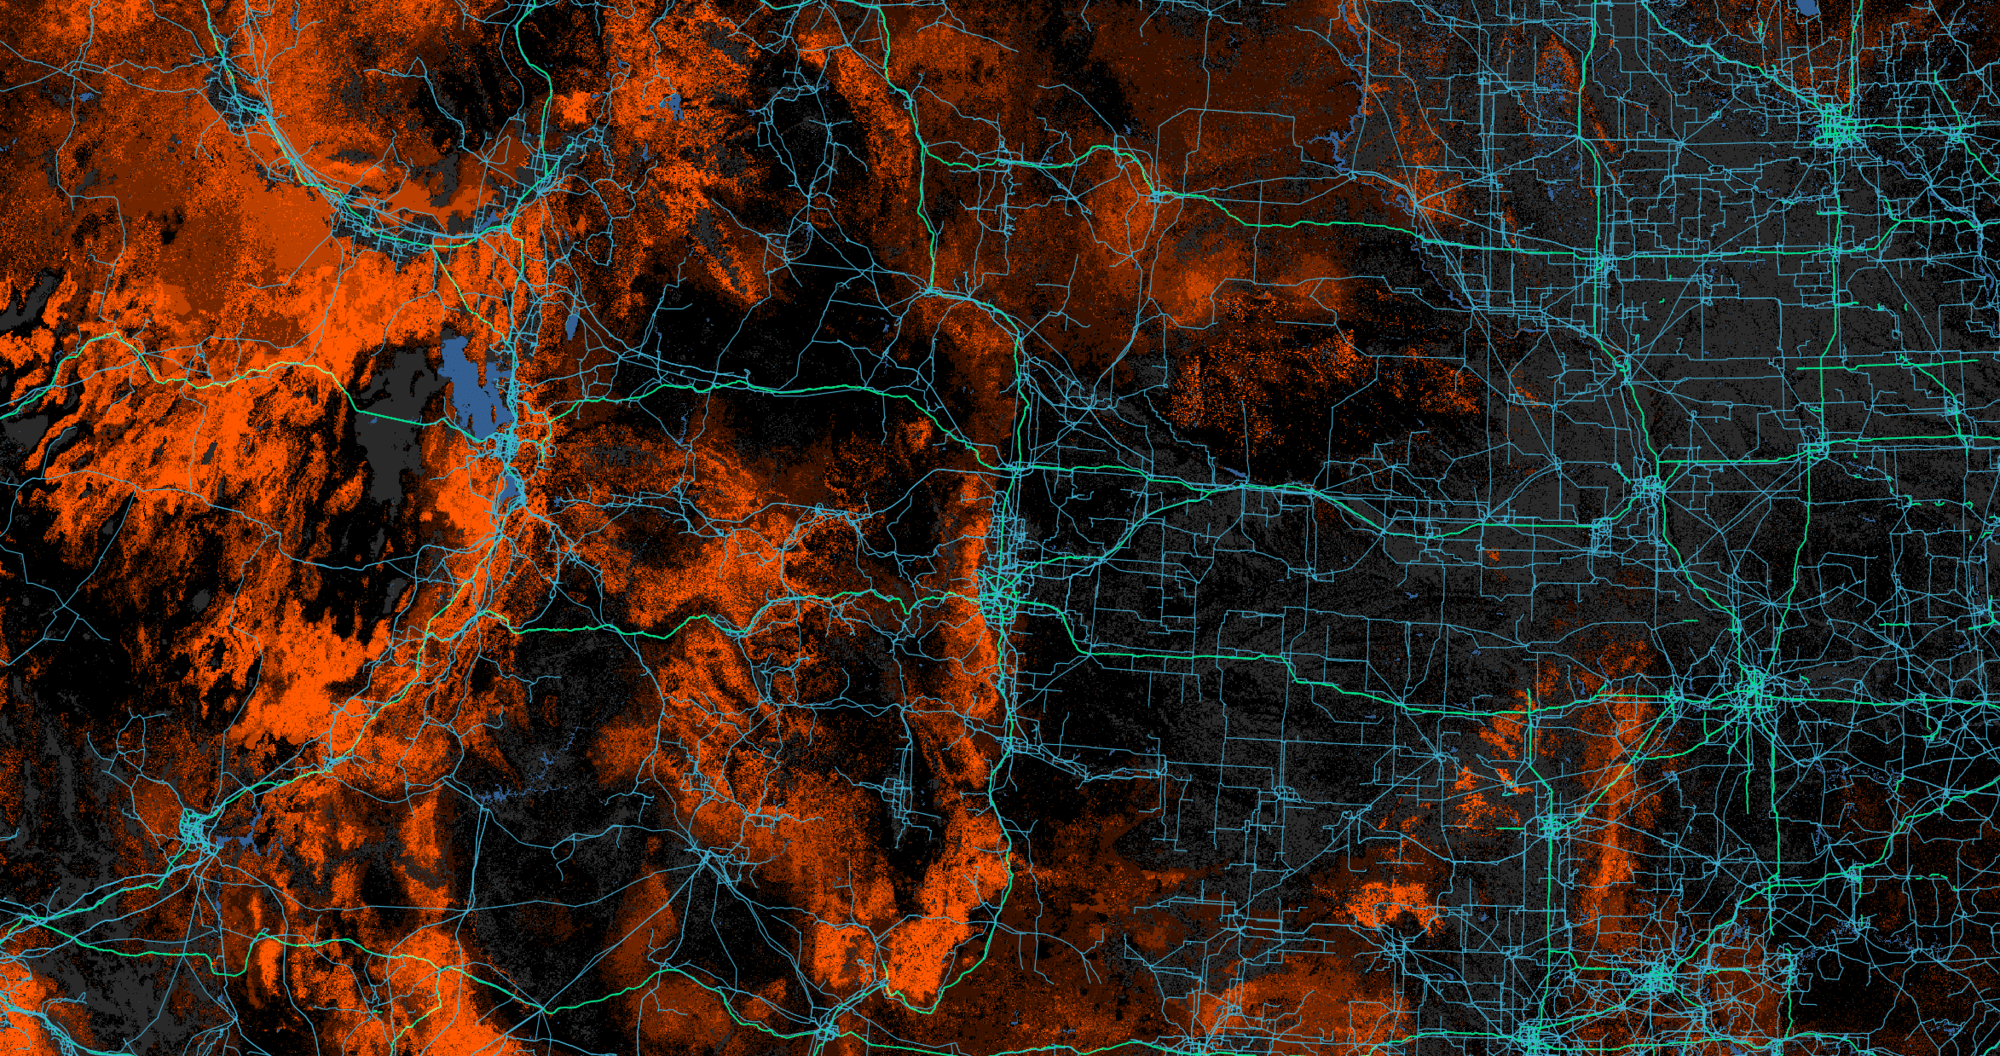
Wildfire Risk & Powerlines
QGIS
Blender
3D Map in QGIS & Blender
- Exported map from QGIS in B&W or color raster layers
- Imported B&W raster layers to Blender to drive mesh deformation, making a 3D model of the data
- Imported other B&W layers to control Cycles material properties
- Imported color raster layers to create emissive and colored materials
- Rendered fully textured 3D model of the map using Blender Cycles rendering engine
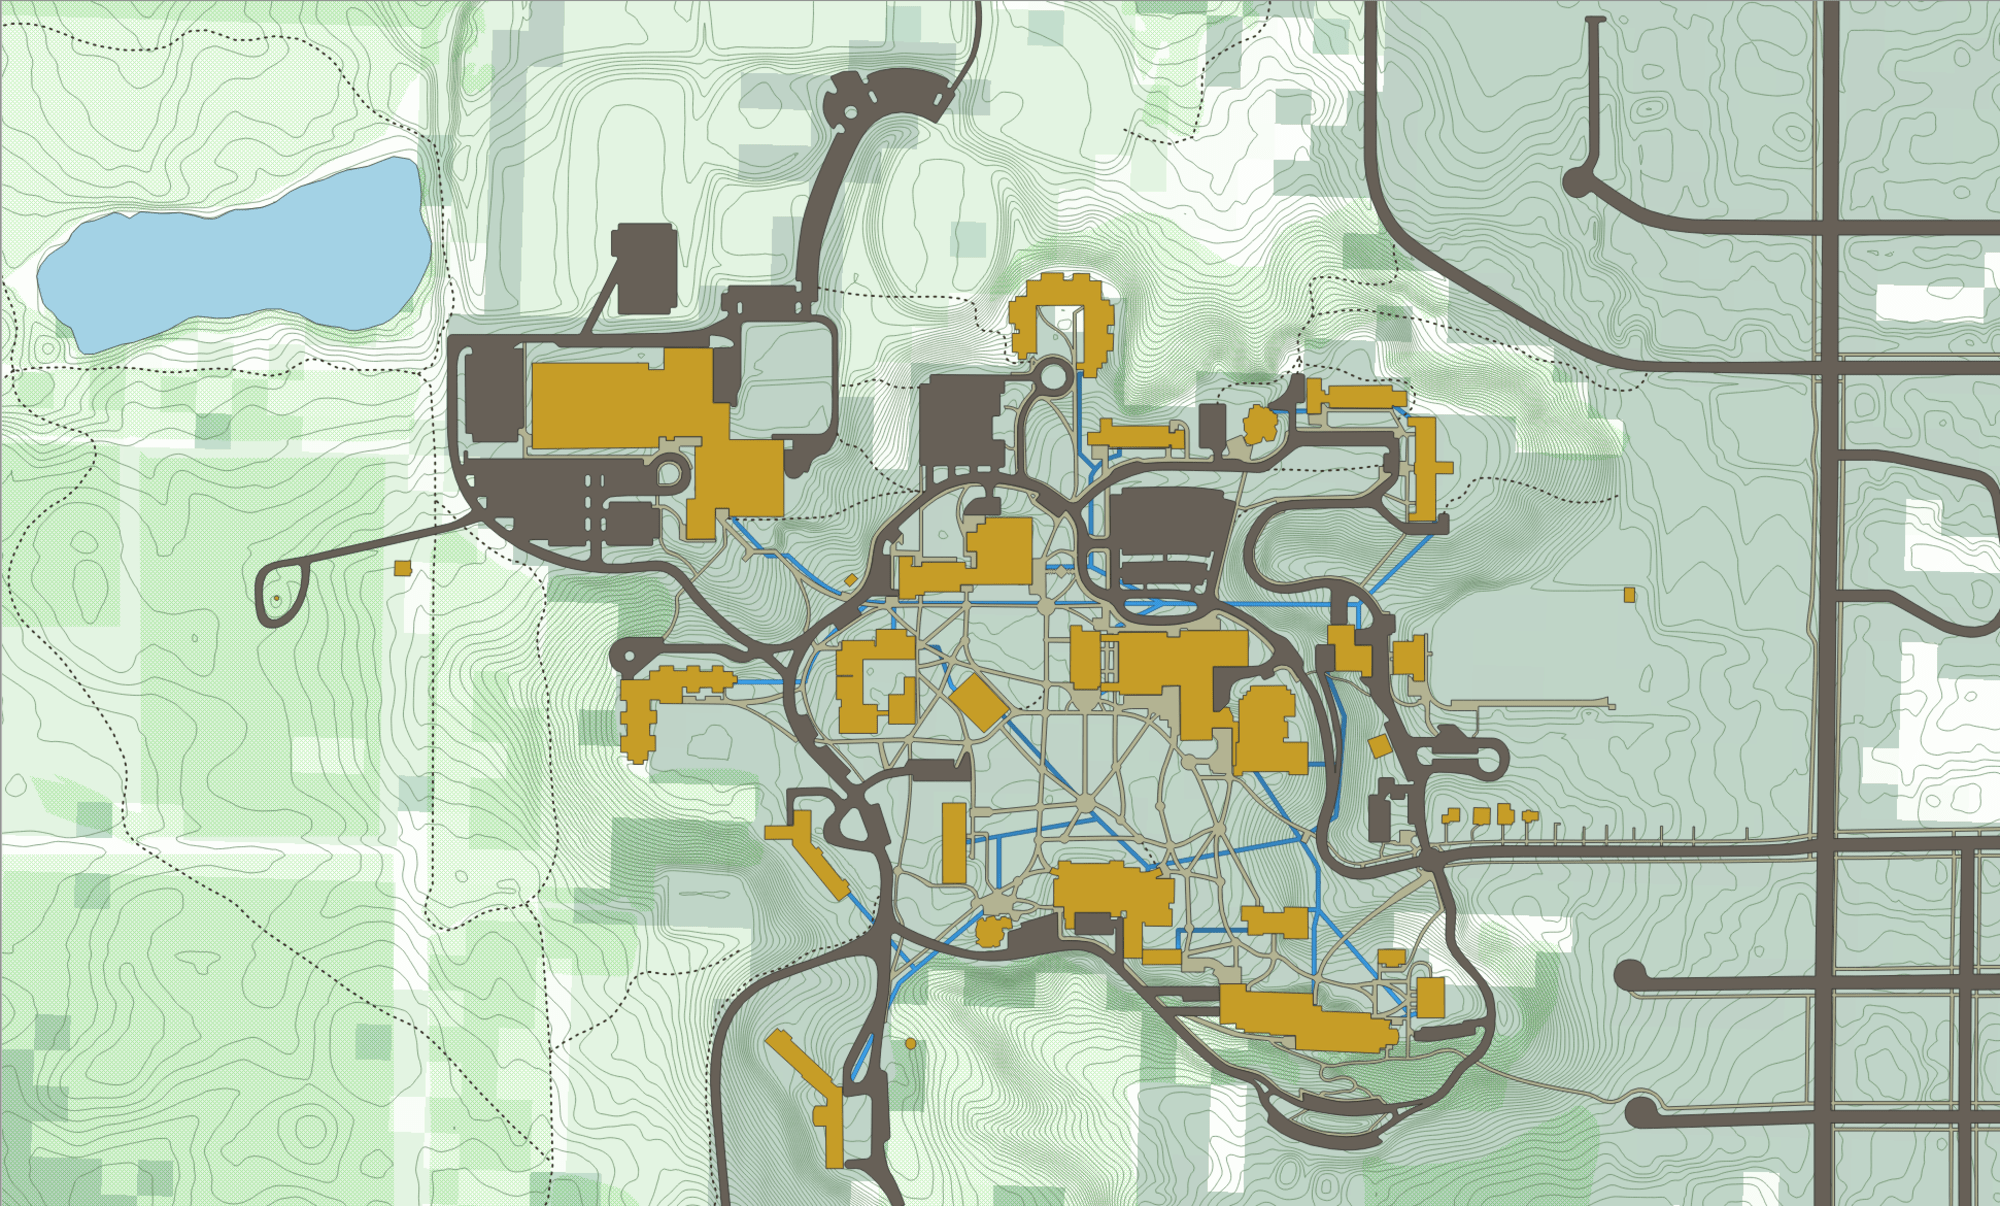
St Olaf Map
QGIS
Illustrator
Drawing Shapefiles in Illustrator
- Imported satellite imagery from Mapbox and Google Earth into Adobe Illustrator
- Drew outlines around all paths and roads
- Used Illustrator's Pathfinder tools to ensure each feature was a single, enclosed path
- Converted paths to shapefile polygons
- Georeferenced polygons to WGS84 projection
- Extracted topo contours from 1m LIDAR data
- Transformed and overlaid other georeferenced data
Data Sources: |
|
| Satellite Imagery: | Mapbox (Gaia Subscription), Google Earth |
| LIDAR: | Minnesota Geospatial Commons |
| Vegetation: | GAP/LANDFIRE National Terrestrial Ecosystems 2011 |
| Natural Lands Pond: | St. Olaf GIS |
| Steam Tunnel System: | St. Olaf Framework Plan 2016 |
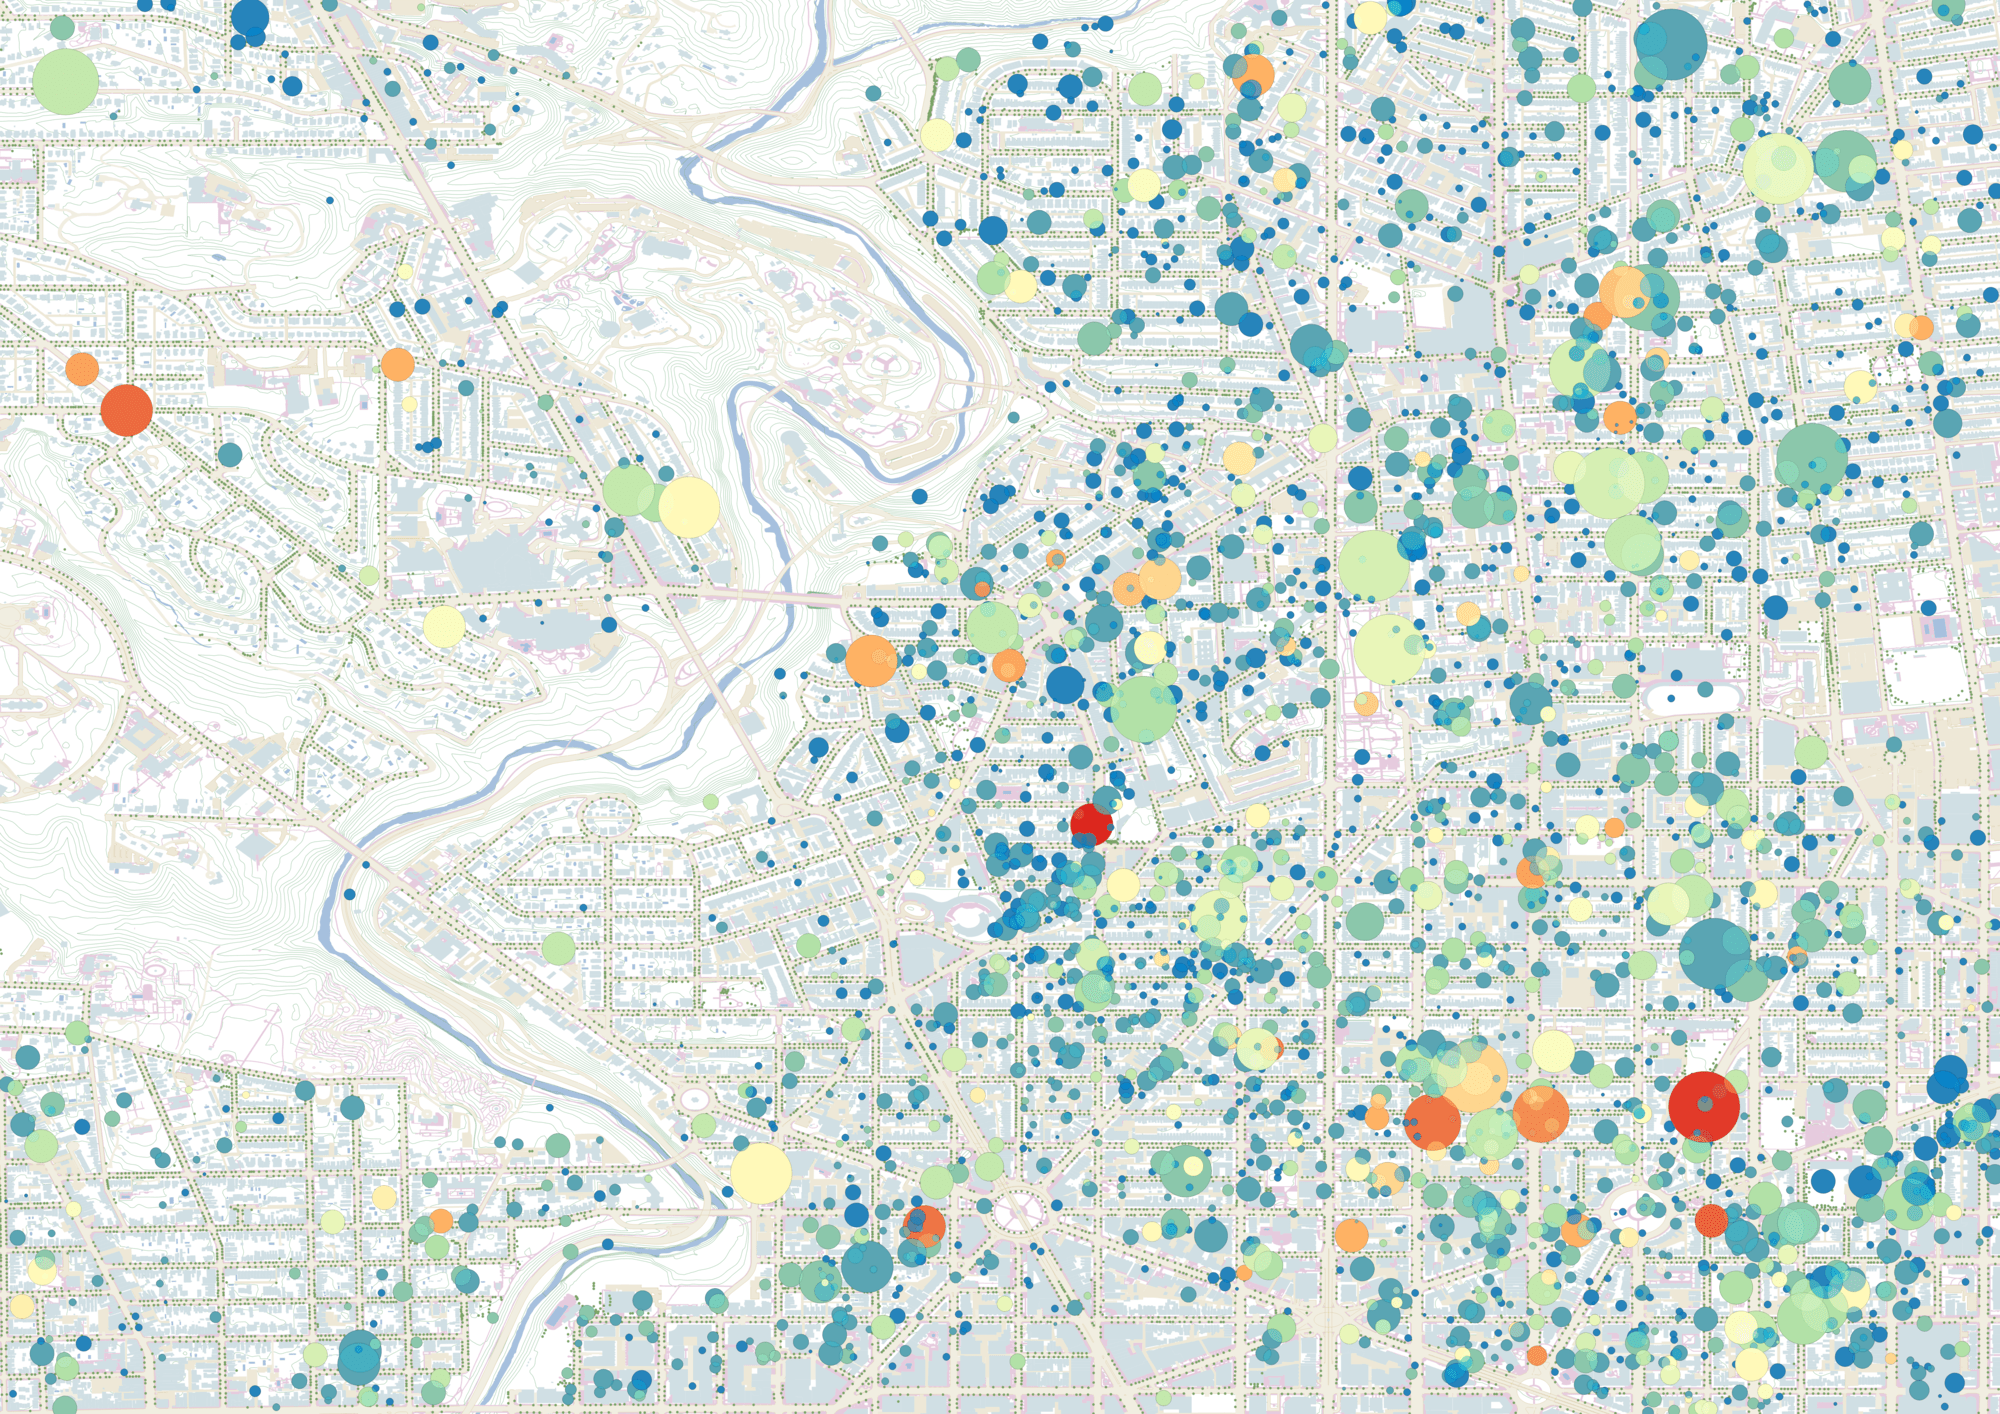
Washington DC AirBNB Map

QGIS
R
Python
Washington DC Airbnb Map
- Maps intended to visualize inputs for a price-prediction regression
- Upper map circles represent AirBNBs, colored by price and sized by the number of people each AirBNb accomodates
- Hard light blending mode makes it easier to see all the datapoints, while allowing them to overlap and without losing saturation and intensity like if they were blended with opacity
- Lower map colors all buildings by the LD50 sound level at that point in the city—louder areas are red
- Original plan was to test if sound level was significant; as a proxy test for missing variables, but it was not significant.
- Surprisingly, a geospatially lagged model did not significantly outperform a standard regression
Data Sources: |
|
| Building Footprints: | Open Data DC Building Footprints |
| Swimming Pools: | Open Data DC Swimming Pools |
| Railroads: | Open Data DC Railroads |
| Trees: | Open Data DC Urban Forestry Trees |
| Curbs: | Open Data DC Curbs |
| Roads: | Open Data DC Roads |
| Sidewalks: | Open Data DC Sidewalks |
| Alleys & Parking: | Open Data DC Alleys and Parking |
| Water: | Open Data DC Waterbodies |
| Topography | Open Data DC 10 foot contours
Open Data DC 2 foot contours |
| Sound Level | Geospatial sound modeling. 2013-2015, NPS IRMA |
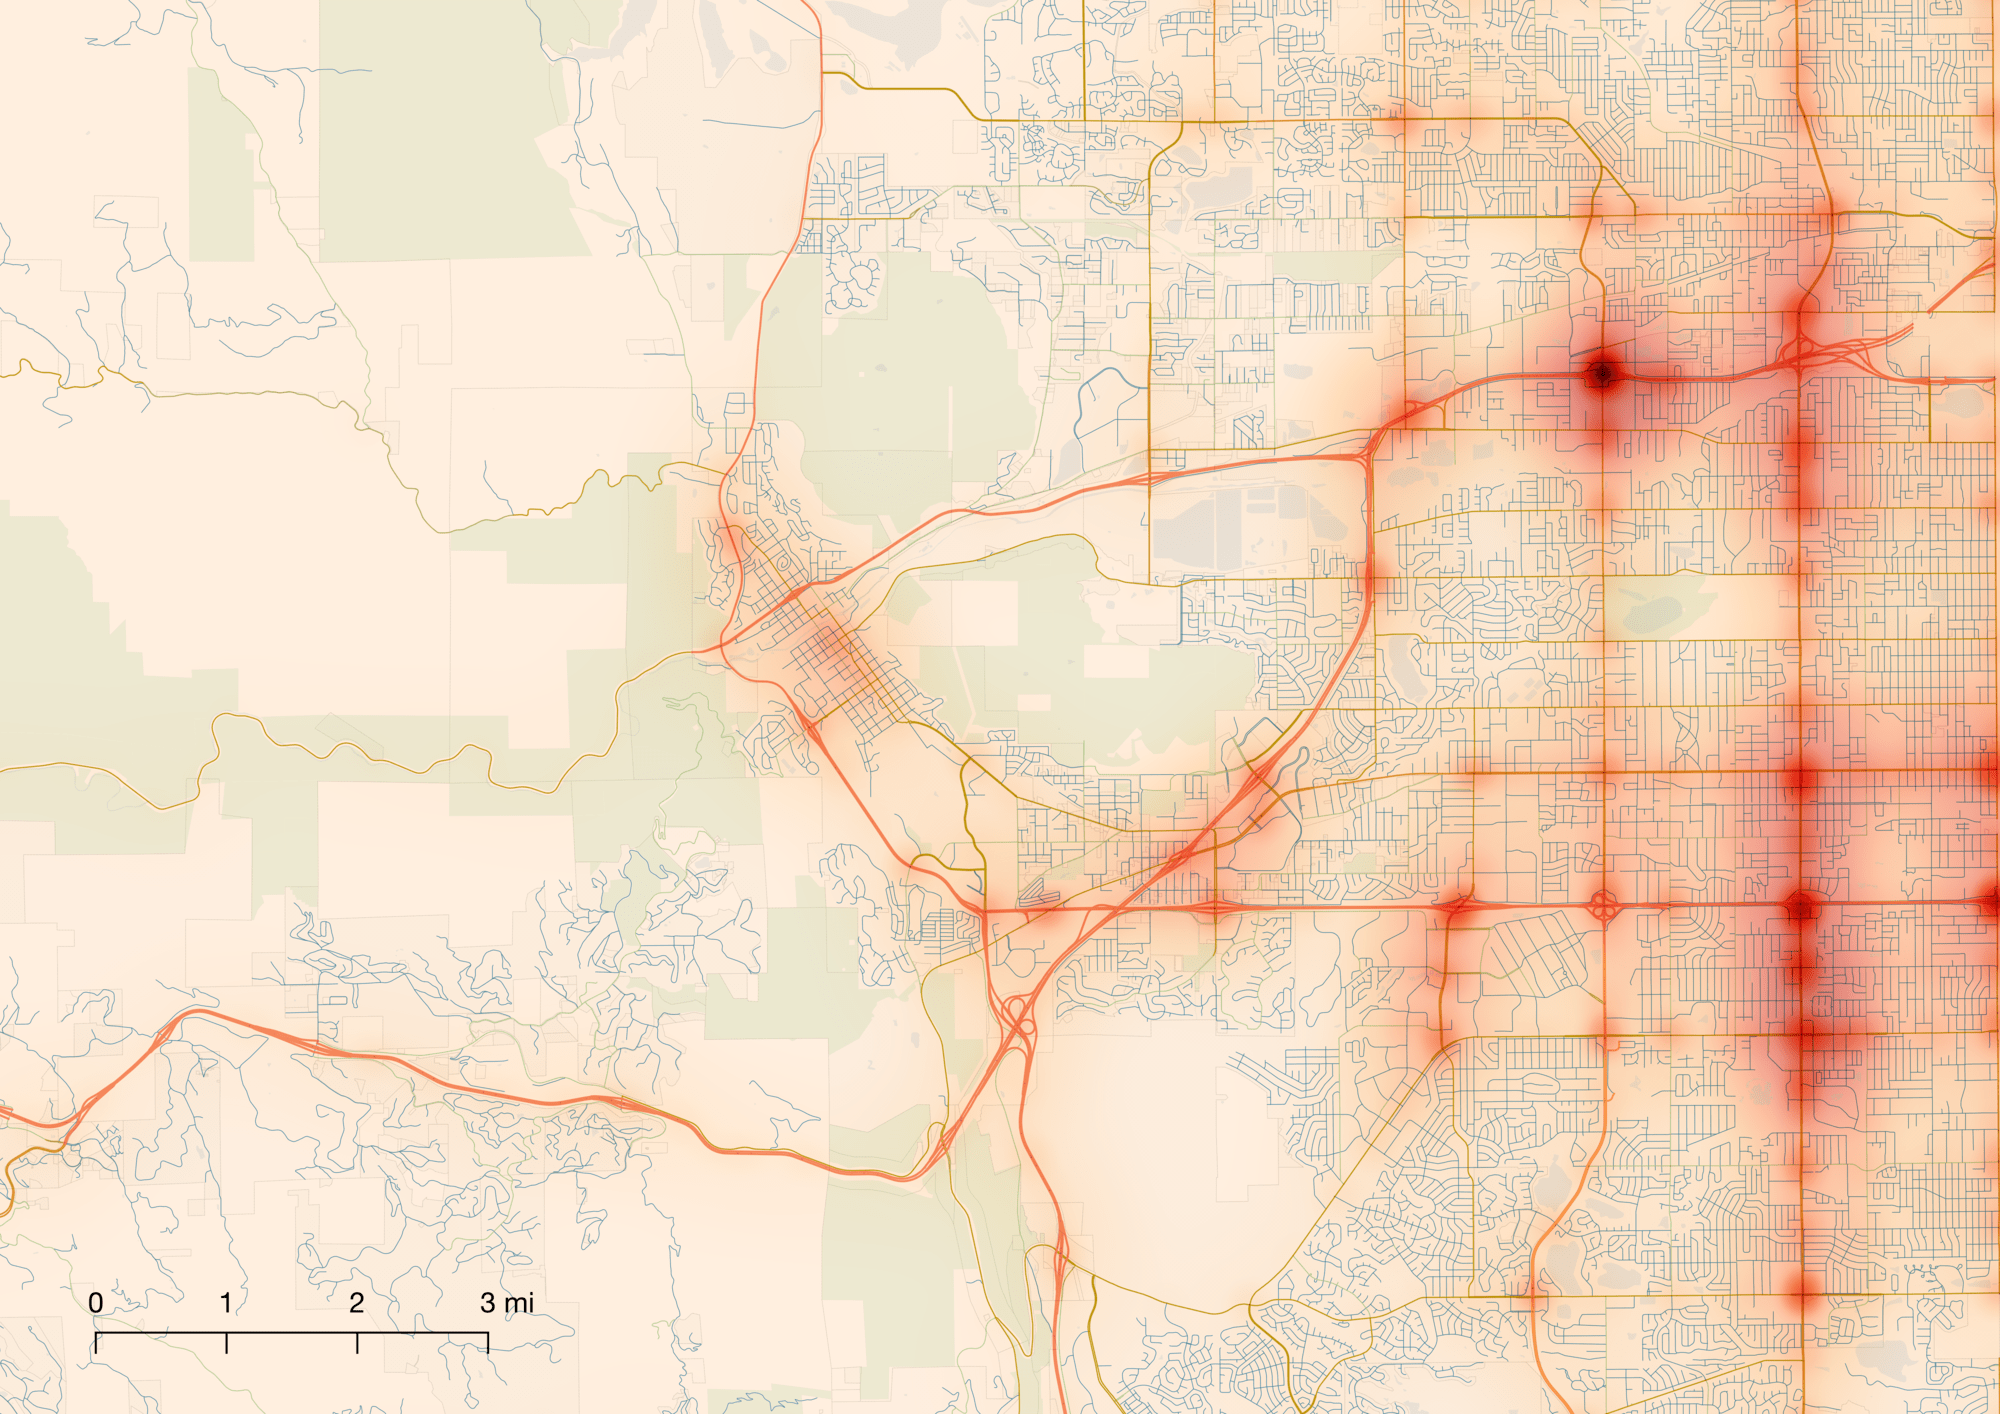
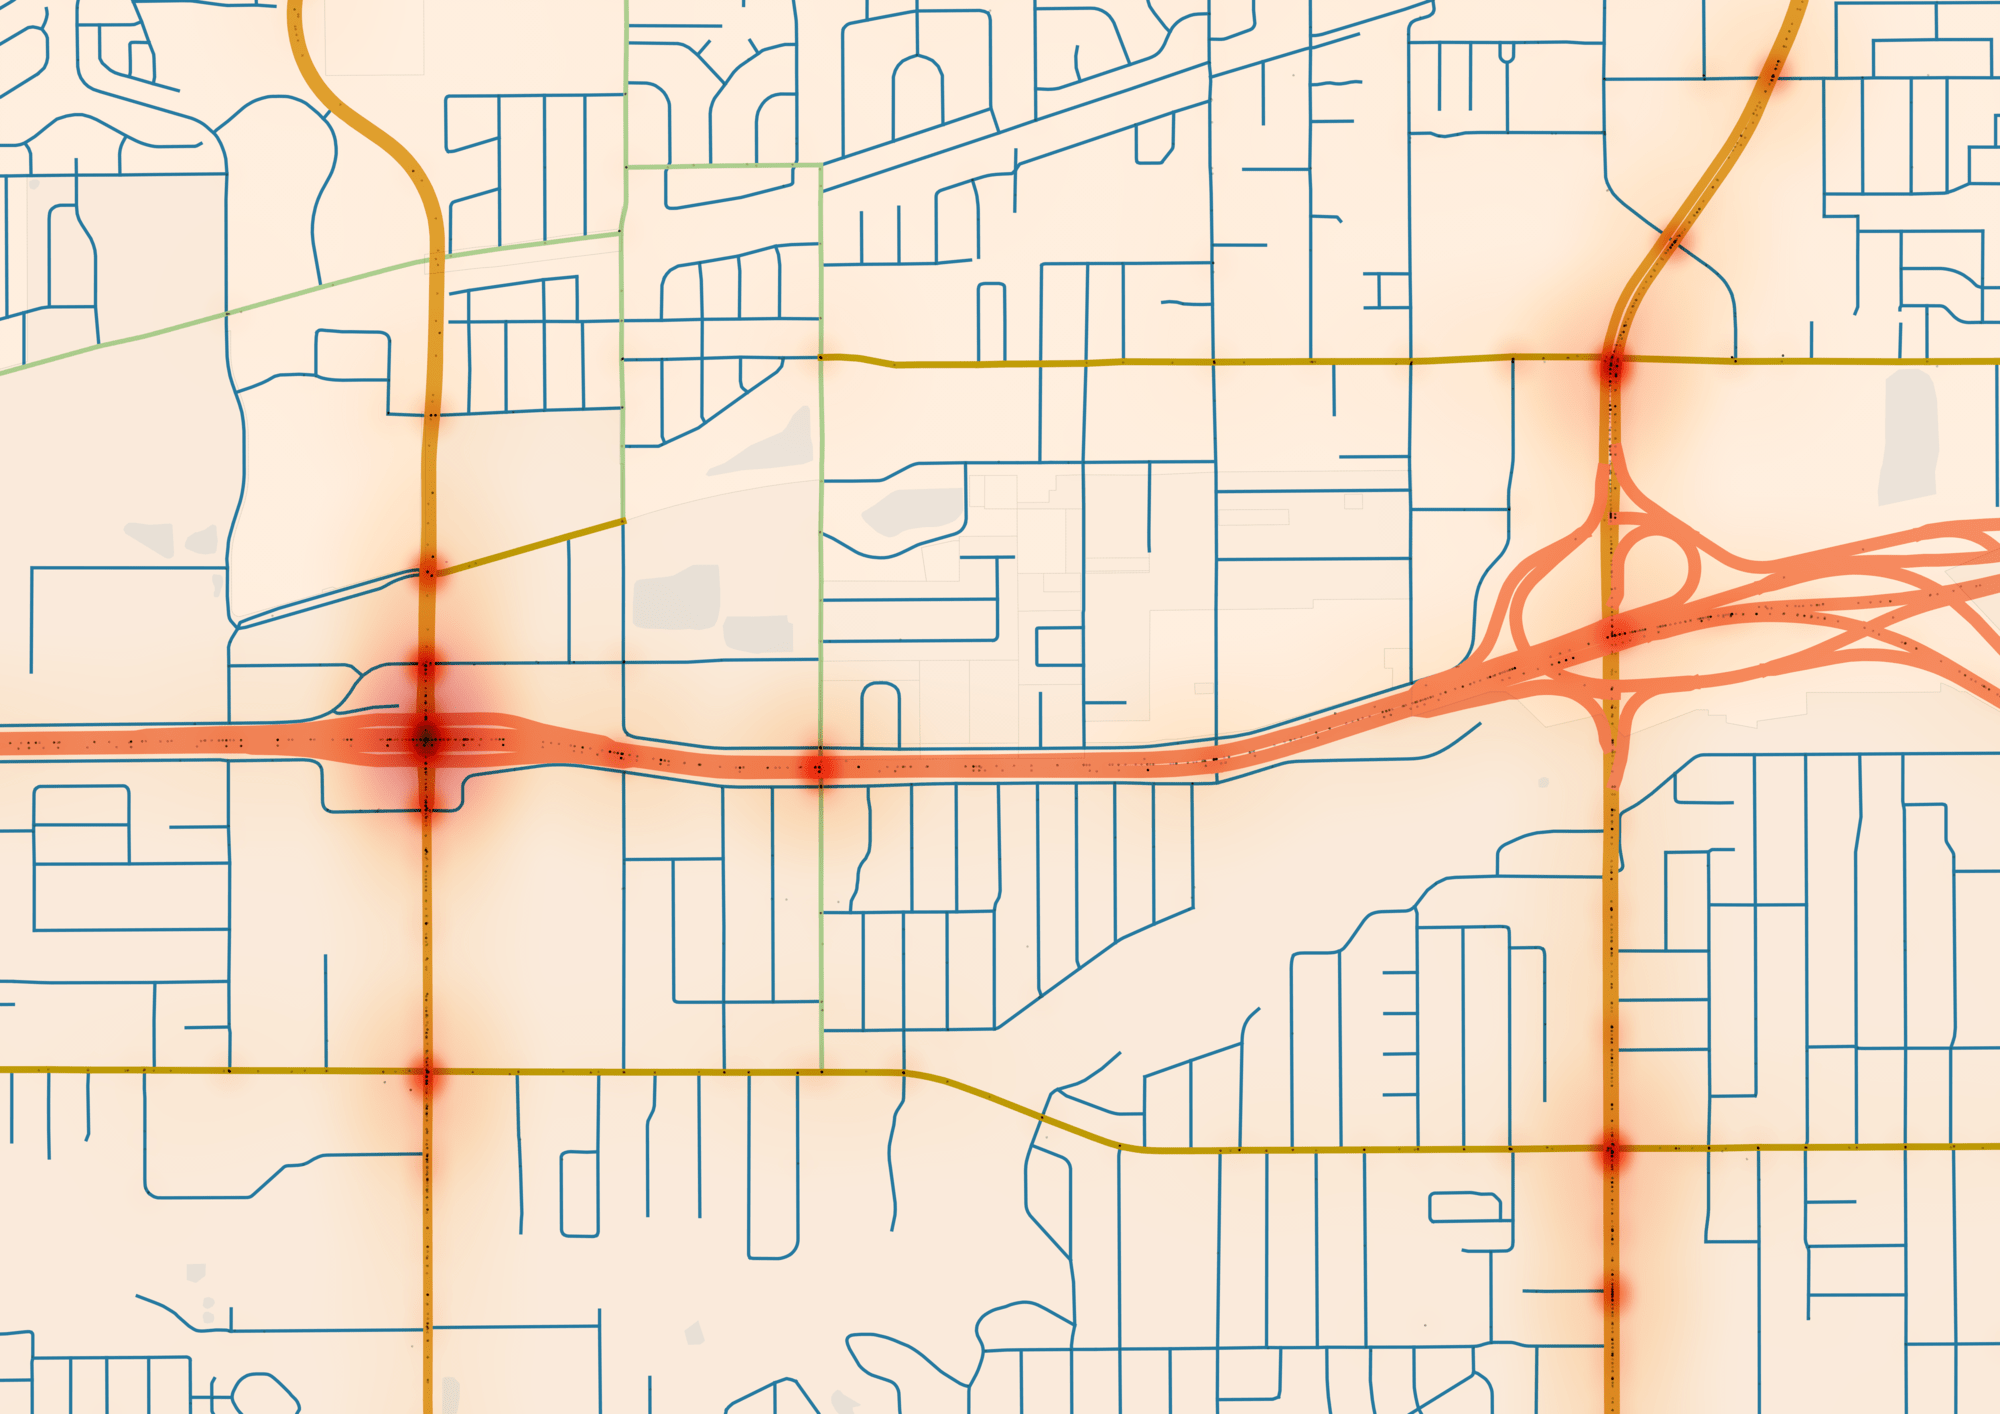
Jeffco Car Crashes
QGIS
Subtle Basemap, Bright Data
- Gathered zoning areas, water areas, and open space areas to create subtly textured basemap
- Overlaid all recorded Jeffco crashes as tiny points
- Rendered transparent 5mm radius linear heatmap of crashes
- Rendered transparent 20mm radius linear heatmap of crashes on top
- Combined, the two heatmaps approximate a non-linear heatmap falloff which makes the data more comprehensible at a glance
Data Sources: |
|
| Crashes: | Jefferson County Crash |
| Zoning: | Jefferson County Zoning |
| Open Space: | Jefferson County Open Space |
| Water: | TIGER/Line Areawater |