Analytics
HIV Policylab Policy Changes Across Region Groups Analysis
Python
- Identified two sets of regions with disctinct change patterns
- Dataset cleaning and restructuring to robustly define and carefully asses changes in policies between years
- Challenging to handle missing data, gaps in data, changing definitions, and other complexities
- Foundation for regression analyses I ran later in this project to asses relationship between policies and outcomes
Project Details |
|
| Company: | Talus Analytics |
| Partner: | O’Neill Institute for National and Global Health Law at Georgetown University Law Center |
| Partner: | Georgetown University Center for Global Health Science and Security |
Talus Analitics Epi Sim Javascript Implementation
Svelte
Javascript
- Re-implementation of existing Talus epidemic model originally written in Python
- Adapted open source interface written in Svelte to work with the Talus model
- Model runtime changed from tens of seconds to tens of milliseconds
- Sufficient performance for the model to display in 60fps as the user interacts with the controls, making the parameters much more intuitive
- Allows user to manipulate 13 different paramters in addition to marking behavioral changes directly on the plot
- User can download each model run as a CSV file
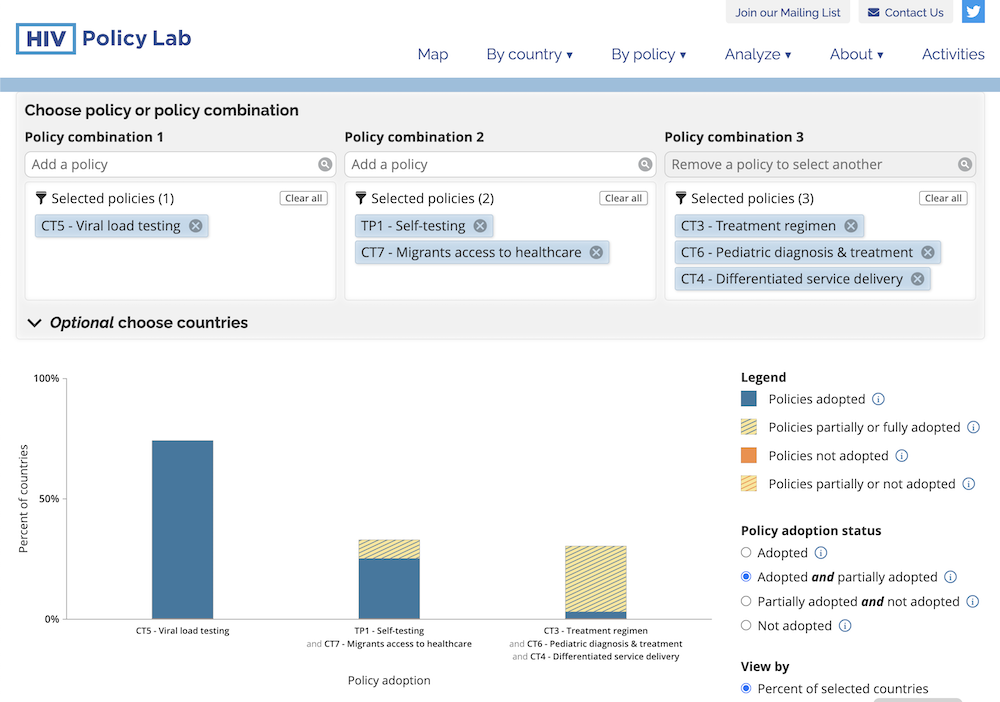
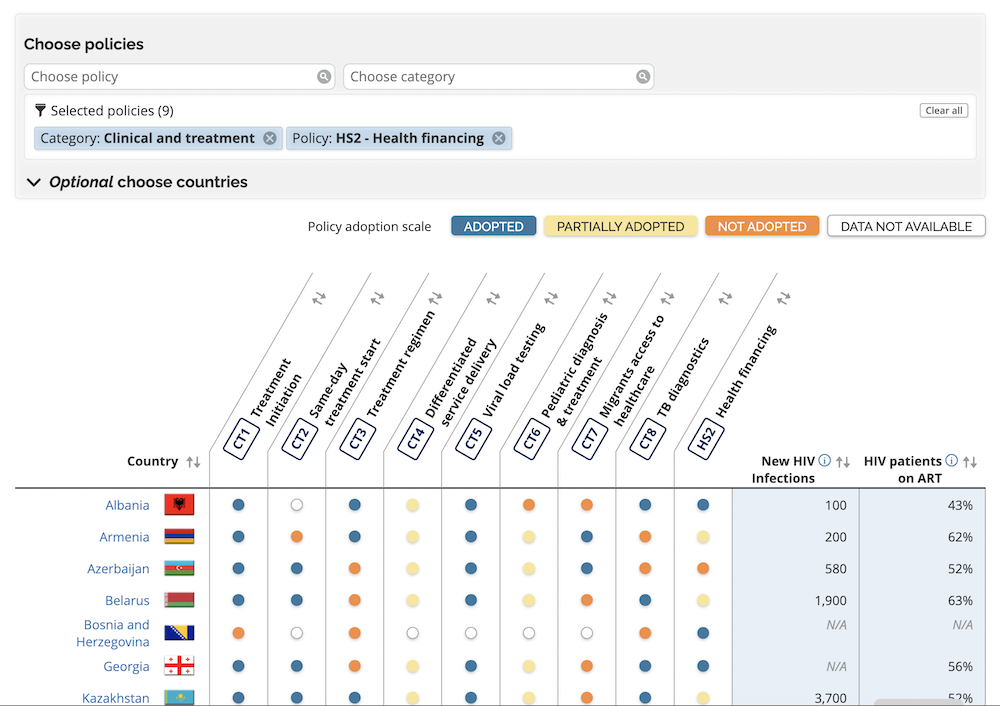
HIV Policylab Policy Combinations and Adoption Table Tools
React
SVG/HTML/CSS/JS
- Allows researchers to visualize adoption of combinations of policies
- Options for visualizing both partial and complete adoption, terms which were challenging to define and implement correctly
- Took on development role implementing functionality of the tool and integrating it with the existing site and datastructures
- Worked closely with the team to iterate the precise functionality of the tool, and specific meaning of all terms
- Implemented in pure React.js, as an early trial of what later became my DimPlot library
- Designed and implemented single datastructure for both graph and tabular form
- Implemented reusable filter components and system for both of these analyses and others on the site
Project Details |
|
| Company: | Talus Analytics |
| Partner: | O’Neill Institute for National and Global Health Law at Georgetown University Law Center |
| Partner: | Georgetown University Center for Global Health Science and Security |
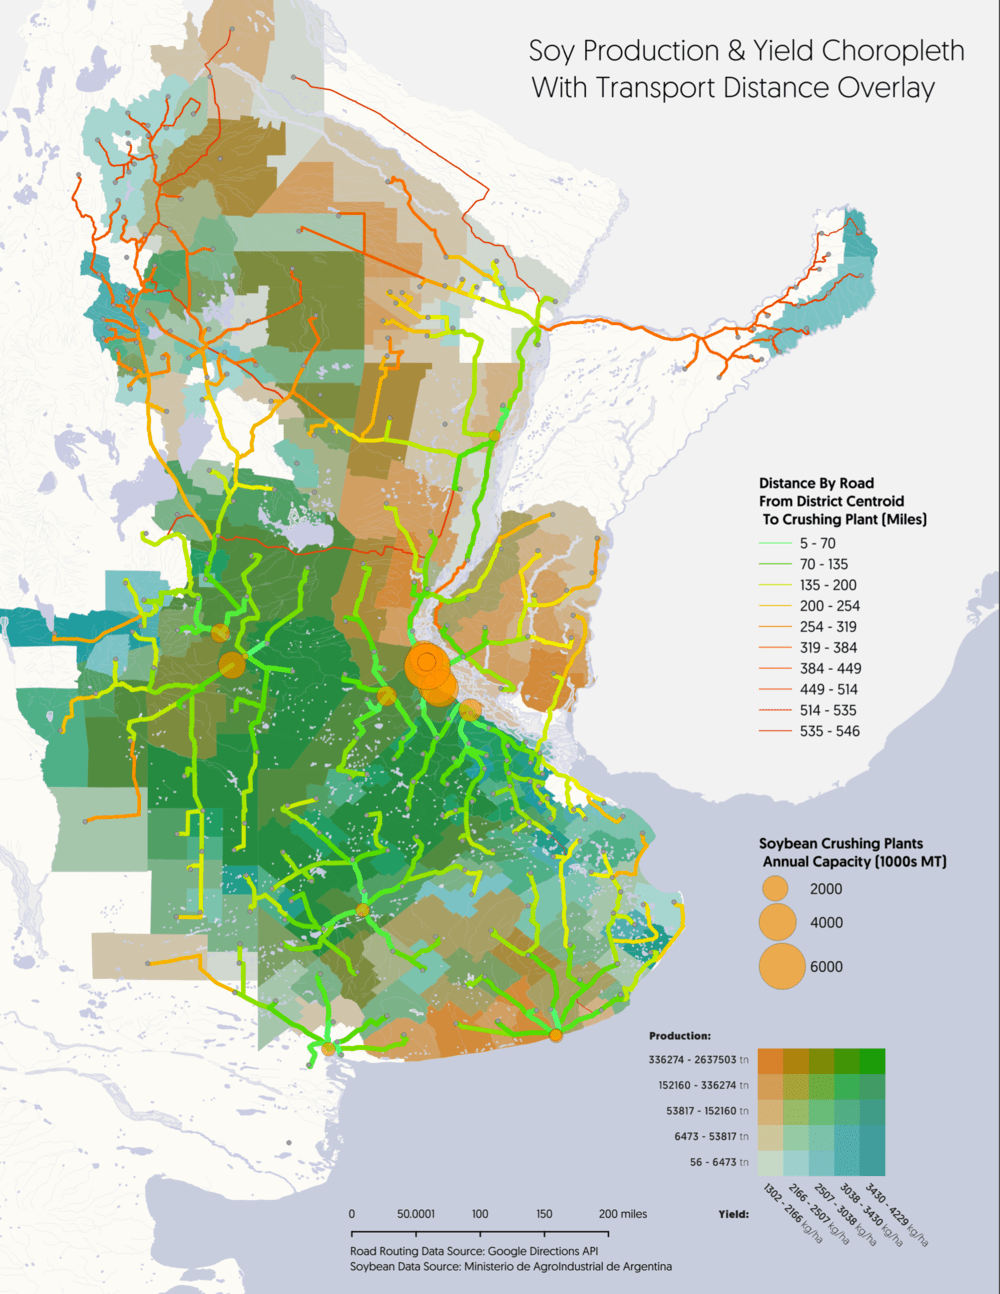
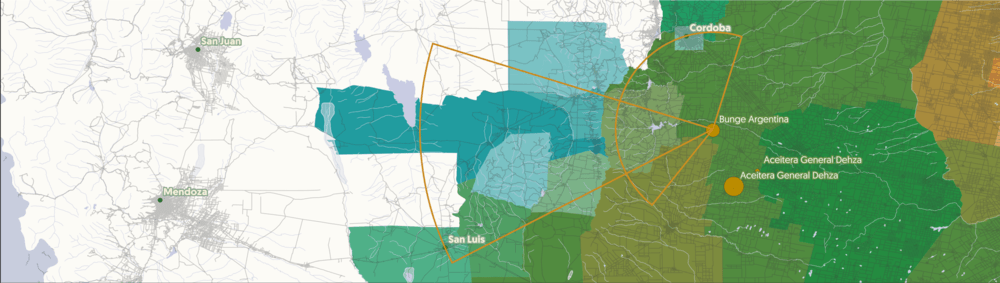
Agriculture in Argentina
Python
QGIS
Illustrator
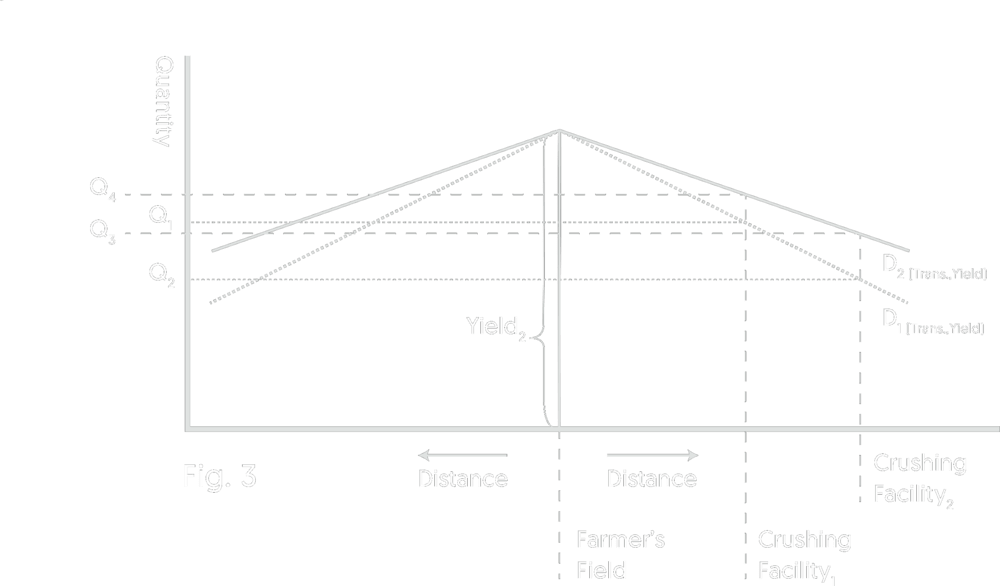
- Long-term project demonstrating connection between Argentine transportation network and farmers' crop planting decisions
- Created georeferenced dataset of Argentine soy crushing facilities by hand using printed data from the Bolsa De Comercio De Rosario and satellite imagery
- Created driving dataset of duration and driving distance between every soy-producing district in Argentina and every soy-crushing facility in the country using Google Maps Distance Matrix api
- Retrieved 7,000+ driving paths for mapping using Google Maps directions API
- Developed econometric model for interaction between road system and planting decisions
Download Full Paper
Data Sources: |
|
| See Works Cited (too many to fit here) | |
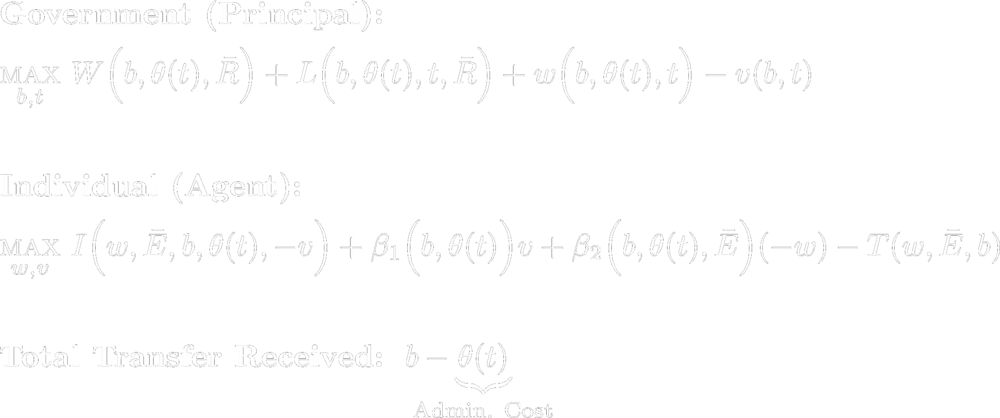
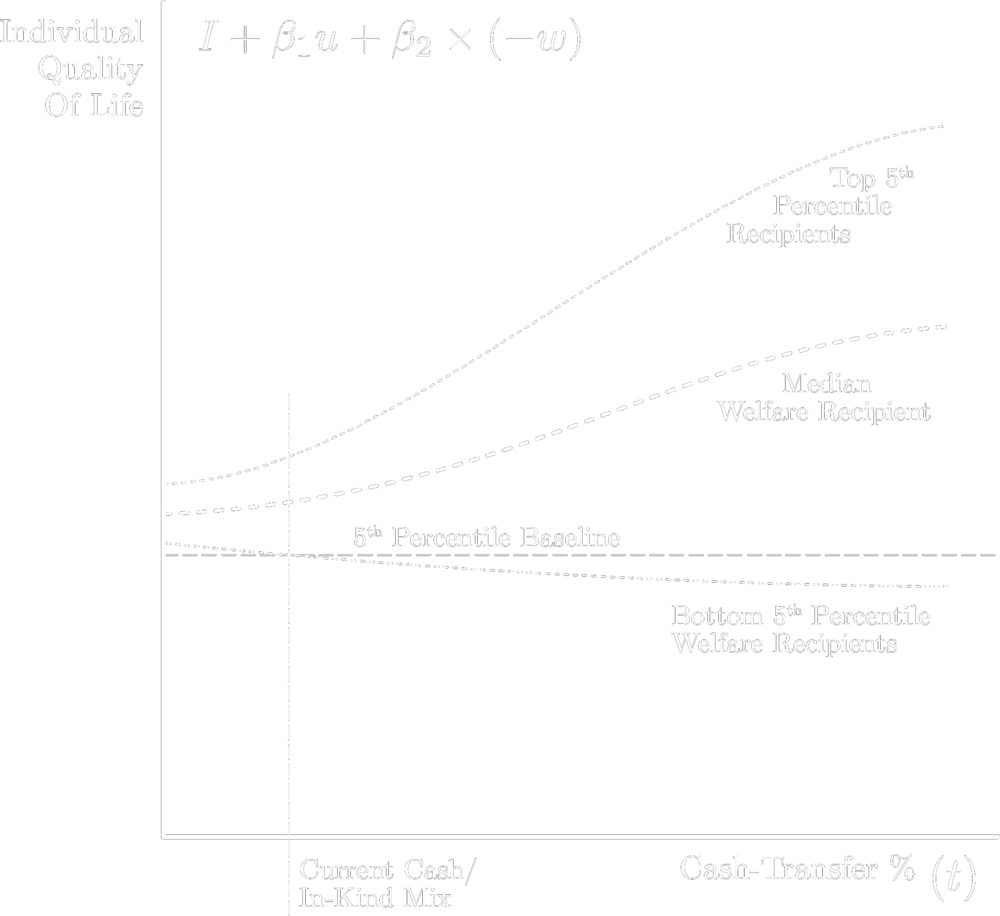
Behavioral Economic Analysis of Basic Income
LaTeX
- Economic paper summarizing most basic income studies worldwide and proposing a behavioral economic model for assessing te effectiveness of future programs
- Principal - Agent model
- Extensive literature review
Download Full Paper
Data Sources: |
|
| See Works Cited (too many to fit here) | |
Long-Term Exercise & Resting Heart Rate
Python
- Plot showing 22 months of resting heart rate (RHR) data and workout duration data leading up to and through competing in a sprint triathlon
- Light red line indicates 30-day rolling mean RHR
- Solid light orange indicates 30-day rolling mean workout time in minutes
- Standard deviations are visualized in light pink to illustrate variability—a correlation between erratic workout schedules and higher RHR variability is visually apparent
- Data scraped from Garmin Connect website using mouse automation
- Parsed & cleaned using Python (numpy/pandas), and plotted using matplotlib
Data Sources: |
|
| RHR / Workout Minutes: | Scraped from Garmin Connect webapp |